How to customize events and calculate contractual KPIs with GreenPowerMonitor’s Horizon Solar Logbook
Most contractual agreements for solar energy assets rely on custom key performance indicators (KPIs) to evaluate the fulfilment of the agreement. The calculations behind these KPIs must comply with all the considerations and nuances described in the corresponding agreement. This includes how to calculate losses and categorize events. Moreover, handling data-related issues requires the ability to update the data while maintaining traceability, to ensure the utmost data quality. These types of KPIs, such as contractual PRs or availabilities, are common in contracts and guarantees for PV plants, including O&M contracts, manufacturer warranties, and capacity tests. GPM Horizon provides a fully automated calculation of PV system losses and categorization of events in a custom reporting system for PV plants, to give users the flexibility to customize them as needed, maintaining a record of all changes to ensure transparency.
As the green energy transition drives increasing demand for solar energy, the market grows not only in size, but also in complexity. In keeping with its tradition of innovation and market leadership, GreenPowerMonitor, a DNV company, previously launched GPM Horizon Solar: a single modular platform to empower asset owners and managers to shape the future of renewable energy management.
This article delves into how the GPM Horizon Solar Logbook is designed to empower you to evaluate PV plant performance and calculate all required KPIs according to your contractual agreements. By the conclusion, you’ll have an understanding of how to use the Logbook feature for your solar plant, including event categorization and calculations of energy production and losses.
GPM Horizon Solar: asset management and KPI calculation
In solar plants, calculating KPIs is usually a two-step process:
- Calculation of generation, losses, irradiance, and any other variables included in the formula for each KPI.
- Definition of the periods to include or exclude in the final calculation.
Automatic loss calculation and event categorization are essential for efficient asset management. However, a one-size-fits-all solution is not realistic, as each asset has its own conditions and KPI definitions. Moreover, data can only enable automatic categorization to a certain extent, as some nuances go beyond what can be inferred from SCADA data alone. For instance, determining whether the responsibility for an inverter breakdown lies with the plant operator or the manufacturer requires additional context. Therefore, users need automated KPI calculation that they can use on a regular basis, while at the same time supporting context-specific customizations. GPM Horizon Solar calculates losses down to the level of individual strings, on a five-minute basis, with the Analysis module providing full visibility.
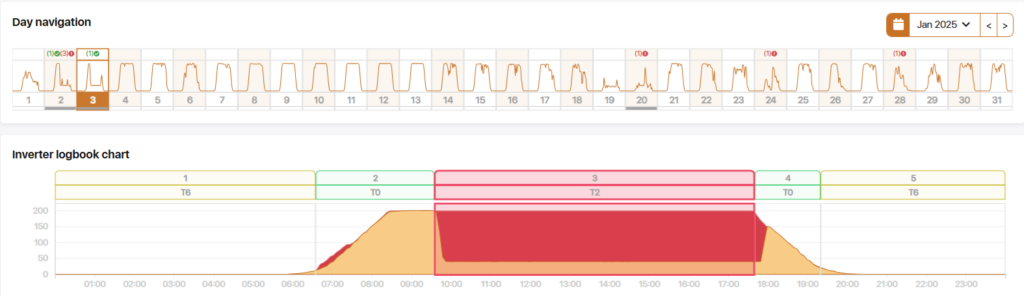
The Logbook module processes all available data, segmenting performance into blocks and assigning time categories (also called “T-categories”). Users can also modify the blocks, while keeping a record of all the changes. Finally, all block information and their t-categories are available for further analysis and customization of the KPIs. For example, it is possible to calculate a KPI that takes into consideration only a given set of t-categories while excluding periods or losses caused by preventive maintenance, or by employing them as variables in equations to produce customized metrics.
Features and tools in GPM Horizon Solar’s Logbook
The Logbook includes a set of tools in a custom reporting system for PV plants to help evaluate events and customize or recategorize them if required.
Event categorization
The Logbook splits performance into blocks and assigns a t-category. This allows the classification of events not only by the type of loss (e.g., inverter breakdown) but also by their root cause (e.g., forced outage vs. scheduled maintenance). GPM Horizon’s team of renewable energy experts has defined over 30 t-categories, following strict international standards for wind energy (IEC TS 61400-26-1) and solar energy (IEC TS 63019:2019). This resource provides a detailed understanding of the operational status of the assets.
The main categories are divided into detailed hierarchies. For example:
- Forced outage (T2).
- Force outage assigned to PV plant operator (T2.1).
- Forced outage assigned to service company manufacturer (T2.2).
GPM Horizon automatically assigns t-categories based on asset performance and all signals available. Nonetheless, events can be recategorized by the user to ensure they are categorized according to the contractual agreement.
Calculations of energy production and PV system loss calculations
The Logbook provides multiple metrics about the performance of each block. Similarly to event categorization, users can customize these values, which is especially useful in cases when there is a loss of communication with the plant or inverters. In such cases, users can manually enter values into the blocks by contacting the on-site team, validating the breakdown, or providing the values to be used otherwise.
Log and comments
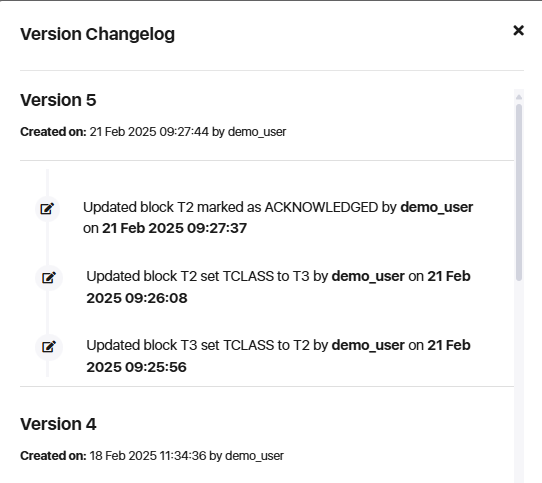
The Logbook incorporates a log for every change, keeping traceability of “who changed what and when”. This allows users to view previous versions and the changes between them. The Logbook also offers undo and redo options to navigate between changes. Moreover, users can comment on the corresponding block. In this way, they can justify the reasons behind each change, ensuring the highest data quality for KPI calculation.
Block generation and customization
he Logbook provides blocks based on the measured performance and all available signals. Nevertheless, users can create new blocks by merging or splitting the existing ones as needed. When a user creates a new block, the Logbook automatically recalculates all relevant information for the new blocks, guaranteeing maximum accuracy for the data.
Plant-level modifications and visibility
While the Logbook creates blocks for individual devices and allows the user to customize them on a case-by-case basis, it is not realistic to apply changes to every device on a case-by-case basis. Therefore, the Logbook offers a “Block generator” tool, allowing users to create the same block for any number of devices at once (whether for all of them or just a subgroup). Users can select the event’s start and end dates, the category and subcategory, and attach a comment during the creation of the new block to keep traceability for the reason of the change.
Daily and general views
The Logbook offers a general and a daily view, making it easier to filter events. Additionally, events can be filtered by duration and category, allowing users to assess and verify the most important events at the plant. Moreover, blocks categorized as “underperformance” are clearly labelled with a warning signal to facilitate validation. This lets users validate blocks after reviewing them. Validation removes the warning signal, providing real-time indications to other colleagues and stakeholders that the KPIs are being calculated with valid information.
Plant view
VVisibility into the performance of other devices or of the plant as a whole helps to determine the appropriate category for an event. The Logbook dashboard includes a diagram showing the categorization of peer devices at the plant, using a color scale for easy reference. This provides quick visibility to see whether the categorized event affected other peers as well, and when. Moreover, the performance of the entire plant is available for comparison, helping to understand whether the event impacted the plant at a larger scale or if its impact was limited to the selected device.
Leveraging the full potential of the Logbook to enable the KPI module
The ultimate potential of the Logbook lies in its ability to calculate contractual KPIs based on the needs of each user and project. You can define your own formulas to calculate KPIs based on the information and the category of the blocks.
For example, it’s possible to exclude periods of maintenance, curtailment, and low irradiance when calculating both energy-based and time-based KPIs, such as energy-based availability, performance ratios, and time-based availability.
Best of all, users can independently define as many KPIs as necessary for each plant, ensuring that every asset is evaluated using the appropriate set of KPIs. All custom KPIs are displayed in the KPI module, which also provides data analytics based on performance, losses, and t-classes—topics we will explore in detail in future articles.
Event categorization: GPM Horizon Solar’s solution to meet the challenges of complex asset evaluation
Event categorization is crucial for accurately calculating KPIs for assets under evaluation. While GPM Horizon Solar custom reporting system for PV plants provides an automatic assessment of events, users have full flexibility to customize event categories and associated data ensuring that KPIs are calculated with the correct data. To guarantee transparency and accountability, the platform records and stores every change.
These event categories, along with the values stored in each block, then serve as a basis to calculate the required KPIs based on the contractual agreement. Users can define their own formulas—and as many as needed— and customize the periods to consider based on the event categories.
GPM Horizon custom reporting system for PV plants is available for the solar industry. GPM Horizon also has solutions for the wind industry, and GPM Horizon Energy Storage is launching very soon. Visit our website to find out more about.
Do you want to meet us and talk to our renewable energy experts?
For more information on GPM Horizon Solar for solar asset management, fill in the form to request a meeting with our renewable energy experts who will be available to answer questions, provide demonstrations, and offer insights on best practices.