The rapid evolution of the renewable energy sector demands sophisticated tools for efficient data management and analysis. To address this need, the GPM Horizon platform’s Data Studio module offers a very useful and robust feature: Data Analysis.
This crucial enhancement empowers users with advanced plotting, analysis, and data download capabilities for monitored signals (raw data and KPIs). With this feature, users can create, save, and share data queries, significantly enhancing collaborative efforts and analytical precision.
Let us explore the details and advantages for users
Data Analysis: a comprehensive overview
Multi-technology capabilities
Data Analysis stands out as a versatile, multi-technology feature accessible in GPM Horizon for both wind and solar assets.
This integration gives users the ability to monitor and analyze data from multiple types of renewable assets on a single platform, thus reducing the complexity associated with managing different systems and allows for a more streamlined operational workflow. This simplifies process and ensures efficiency, by providing a unified toolset for data handling tailored for users who manage diverse renewable assets.
Advanced data handling
The core strength of Data Analysis lies in its ability to handle complex data sets.
Users can plot, analyze, and download both raw data and key performance indicators (KPIs), facilitating in-depth analysis and informed decision-making. This feature is designed to cater to the varied needs of asset managers, analysts, and engineers, offering a robust solution for all data-related tasks. The flexibility to handle different types of data ensures that users can gain comprehensive insights into their operations, identify trends, and make proactive decisions.
For instance, asset managers can leverage this feature to identify underperforming assets and promptly take corrective actions. Analysts can dive deep into the raw data to uncover hidden patterns and correlations, leading to more accurate forecasting and optimization strategies. Engineers can assess the health and efficiency of the equipment, ensuring optimal performance and longevity.
Query creation and management
The Query functionality is one of the most powerful aspects of Data. It allows users to create customized queries that filter and analyze data according to their specific requirements. These queries can be saved for future use, ensuring that valuable insights are preserved and can be easily revisited. Additionally, queries can be shared with other members of the organization, fostering a collaborative environment of seamless exchanges of knowledge and insights.
The ability to create and save queries offers substantial value to users who need to perform regular data analysis. By saving queries, users can quickly access previously performed analyses, saving time and ensuring consistency in their analytical processes. Sharing queries enhances collaboration within teams, enabling multiple stakeholders to contribute to and benefit from the same data insights.
Intuitive Dashboard Layout
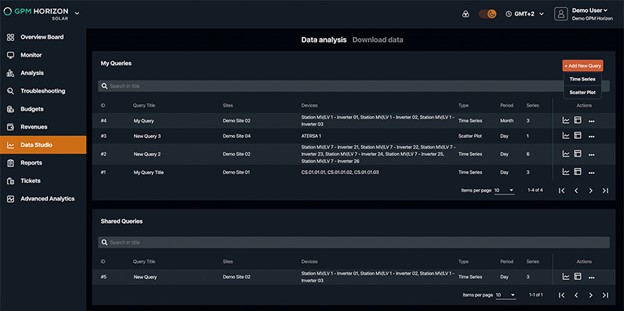
The “All queries” view presents users with a clean, intuitive dashboard that displays all saved queries in a table format. This layout ensures easy navigation and quick access to important data. The dashboard design provides a holistic view of all the queries, categorized into “My queries” and “Shared queries”, making it easy for users to locate and manage their tasks.
Organized Query Tables
- My queries: lists all queries created by the user. The separation ensures that users can quickly access their personalized queries without sifting through shared data.
- Shared queries: displays queries shared by other users within the organization. This feature is particularly beneficial for teams working on collaborative projects, as it provides a centralized repository for shared analytical insights.
Each query has its own quick access button to switching between graph and table views, ensuring users can instantly view data in their preferred format. This functionality enhances user experience by providing multiple ways to visualize and interact with data, depending on the specific requirements of the analysis.
Detailed query information
Each query listed in the tables contains the following details:
- ID: unique identifier for easy reference and tracking.
- Query title: descriptive title that helps users quickly identify the purpose of the query.
- Sites / Devices: information about the assets covered by the query, providing context to the data being analyzed.
- Type: to understand the type of analysis of the specific query, e.g. time series, scatter plot.
- Period: time period covered by the query, allowing users to understand the temporal scope of the analysis at a glance.
- Number of series: number of data series included in the query, giving users an idea of the query’s complexity.
This detailed overview enables users to quickly identify and select relevant queries, ensuring efficient management of their analytical tasks.
Enhanced query management
Users have several management options for their queries:
- My queries: includes options to duplicate, copy, share, and delete. These functionalities provide users with flexibility in managing their queries, ensuring they can easily modify and share their work as needed.
- Shared queries: options include copying to “My queries” and deleting (only available to the “Query creator”). This ensures that shared queries can be personalized without affecting the original version, fostering a collaborative yet controlled analytical environment.
Additional functionalities
- Add new query: button to create new queries with options for “Time series” or “Scatter plot”. This simplifies the process of starting new analyses, providing a straightforward pathway to data exploration.
- Search: functionality to search for queries by title, streamlining the process of finding specific queries. This is particularly useful for users managing a large number of queries, ensuring they can quickly locate the relevant data sets.
Time Series view: in-depth data analysis
Flexible query customization
The “Time series” view allows users to plot data in a detailed and customizable manner. Users can modify the title of the query, navigate easily between views, and save or discard changes. This flexibility ensures that users can tailor their data analysis to meet specific needs, providing a dynamic and adaptable analytical tool.
Chart and Table views
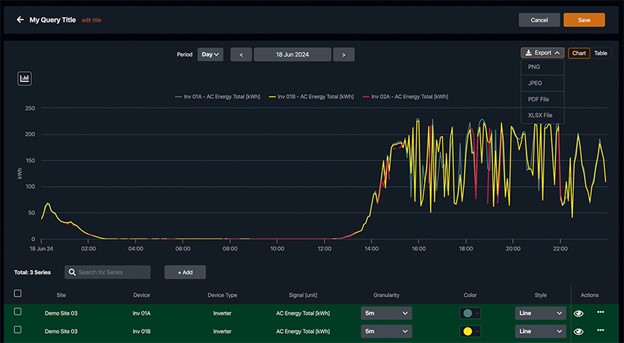
The Time series view offers representations of data in both chart and table forms. The chart view provides advanced visualization capabilities, allowing users to:
- Customize appearance: change colors and styles of data series (for example, bar and line) and toggle visibility. This allows users to tailor the visual presentation of data to their preferences, enhancing the clarity and impact of the insights.
- Export data: export charts in various formats (PNG, PDF, XLS, CSV). This ensures that users can easily share their visualizations in reports and presentations, facilitating communication of insights to stakeholders.
- Interact with data: zoom in and out for detailed analysis and utilize multiple Y-axis for complex data sets. These interactive features allow users to explore data at different levels of granularity (minutes, hours, days, etc.), uncovering detailed patterns and trends.
- Clear time indications: understand data timelines with clear time indications on the X-axis. This ensures that users can accurately interpret the temporal aspects of their data, enhancing the overall analytical process.
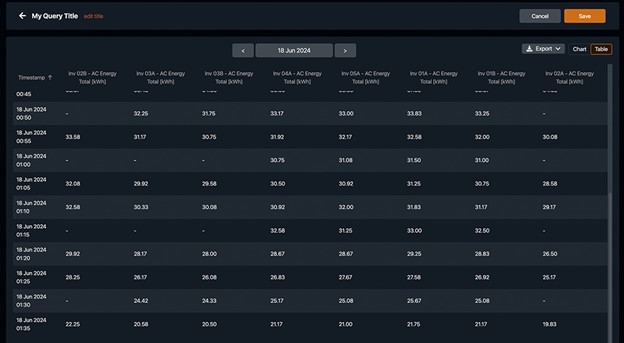
The table complements the chart by displaying all selected data with pagination for large queries. Users can sort columns, ensuring a comprehensive and organized data presentation. The ability to export data in XLS and CSV formats adds to the functionality, making it easy to use the data in other applications. This dual representation of data provides users with a holistic view of their analyses, ensuring they can gain both visual and numerical insights.
Adding and managing data series
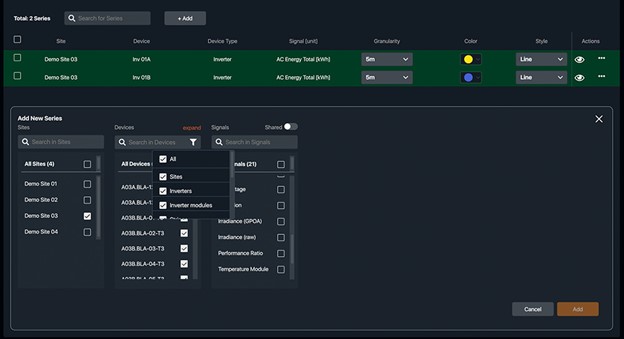
The “Time series” view excels in its ability to manage multiple data series. Users can add new series through a straightforward component, ensuring they have the necessary data for their analysis. The process includes:
- Selecting available assets: choose from all parks/sites in the portfolio. This ensures that users can incorporate data from the specific assets they are interested in, providing tailored insights.
- Choosing devices: select specific devices (e.g., turbines, inverters, strings) within the chosen assets. This granularity ensures that users can focus their analyses on specific devices, enhancing the precision of their insights.
- Filtering signals: leverage filters and search options to find the relevant data points. This simplifies the process of identifying and selecting the most pertinent data for analysis.
Once added, the “Series table” provides an overview and control over the selected series. Users can:
- Search and filter: easily locate specific series. This functionality ensures that users can quickly find and work with the data series they need, streamlining the analytical process.
- Adjust granularity and periods: fine-tune data granularity and periods with intuitive controls. This feature allows users to customize the temporal resolution of their data, ensuring they can analyze trends and patterns at the appropriate level of detail, e.g. day, week, month, year or custom periods.
- Bulk actions: perform bulk actions, such as deleting multiple series. This functionality enhances efficiency by allowing users to manage multiple data series simultaneously.
- Customize series: change colors, styles, and visibility, ensuring the chart reflects the desired data presentation. These customization options ensure that users can tailor the visual representation of their data to their specific needs.
The ability to add and manage data series in a seamless and intuitive manner significantly enhances analytical capabilities. By providing users with detailed control over the data they analyze, this feature ensures that they can derive maximum value from their data sets, leading to more informed decision-making and optimized asset performance.
Scatter Plot View: enhanced analytical capabilities
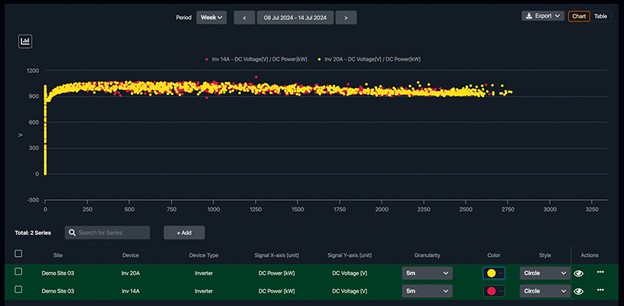
Creating scatter plots
The “Scatter plot” view allows users to create queries that visualize the relationship between two signals. This feature is particularly useful for in-depth analysis and identifying correlations between different data sets. By plotting two signals with points crossing on the Y and X axes, users can gain valuable insights into the interplay between different variables.
Advanced visualization
Users can plot two signals with points crossing on the Y and X axes, providing a clear visual representation of their relationship. This advanced visualization tool enhances analytical capabilities, allowing users to gain deeper insights into their data. Scatter plots are particularly useful for identifying correlations, trends, and outliers, making them an invaluable tool for detailed data analysis.
Real-world applications
The “Scatter plot” view has numerous real-world applications in the renewable energy sector.
For instance, engineers can use scatter plots to analyze the relationship between wind speed and turbine output, identifying optimal operating conditions and potential performance issues.
Similarly, analysts can use scatter plots to explore the correlation between solar irradiance and panel efficiency, uncovering insights that can drive improvements in system design and maintenance strategies.
Future Outlook
The introduction of Data Analysis in GPM Horizon’s Data Studio marks a significant step forward for our platform.
This feature empowers users to gain deeper insights, make data-driven decisions, and enhance operational efficiency, thanks to a comprehensive suite of tools for advanced plotting, data management, and collaborative query functionalities.
Whether managing wind or solar assets, Data Analysis provides the capabilities needed to navigate the complexities of renewable energy data with ease and precision.
The introduction of Data Analysis is transformative for GPM Horizon. In the future, Data Analysis will further integrate with our predictive analytics and machine learning algorithms. Enhanced user interface, customizations, advanced filtering and transformation of data will deepen the analytical capabilities of the platform. Stay informed about our future developments!
Do you want to meet us and talk to our renewable energy experts?
We look forward to connecting with you and sharing our expertise in monitoring, control and advanced analytics and predictive maintenance of renewable assets for utility-scale plants. Fill in the form to request a meeting with our team who will be available to answer questions, provide demonstrations, and offer insights on best practices.
Error: Contact form not found.